( Supporting Text for Discussion )

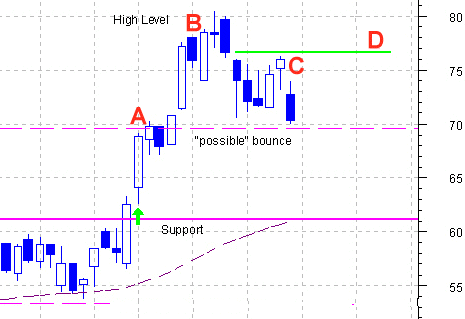
| We will use this chart as an example of a stock that you did NOT see the buy signal until NOW and you are wishing that you had bought it. You are trying to decide where and when to make an entry. The buy had a potential fill at 68.5 (A) and a later high closing price at 78.5 (B) which would later become the technical level to pass before taking an entry. However, this stock met with resistance at 76.25 (C) and then headed south. A logical entry level now would be between the last two high closing values around 77 (D). This is about 12% above the first potential fill after the initial buy signal. If you are concerned that you may be "chasing" this stock, you may wish to read the Supporting Text offered at the top of this page just beneath the title. You may also wish to read the Survival Rules regarding when not to buy a stock. |

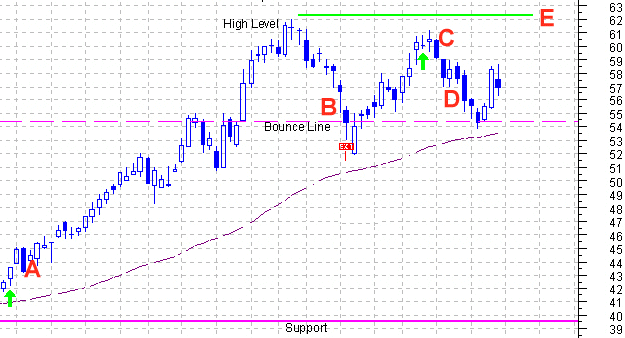
| Here the original buy signal provided a buy potential at 44.0 (A) and then moved on to where the High Level
is shown closing at 61.75. Your Money Management rules would probably have taken you out of this trade somewhere around 57 (B) for about a 29% profit. On the next buy signal your fill potential would have been 60.5 (C) but you would have been forced to sell on your Money Management rules (D) in order to cut your losses and protect your trading capital. Now the stock is beginning to move up again and you would like to take another position in it. The problem occurs when you realize that there will NOT be another buy signal until the system generates a sell signal for those that were not disciplined enough to sell on their MM rules. Therefore you would only want to renter is you could be more assured that this stock would likely not start and then once again quit and retreat. The next meaningful technical level at which this stock traded would be where it quit rising at 60.5 (C), but then you are faced with a short time before hitting the previous level of 61.75 There is only enough potential between those two to (2%) to barely cover your commissions before you will need to look at bailing out again. A more practical level would be to wait until you see this stock trading ABOVE the 61.5 level where the Green Line is shown. (E) |

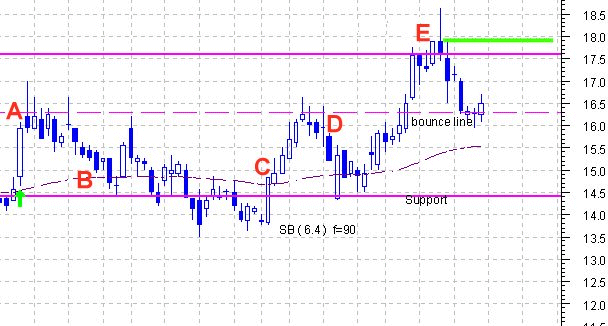
| Here your potential fill would have been 16.25 (A) after which the trade immediately moved against you forcing you out on your MM rules to protect your trading capital. You have drawn a resistance line some months ago which proved to be very meaningful to the technical traders as proven on the initial buy signal as the price moved through this. After trading above this level it became converted to a support line. The trading was below this violated support for about two weeks before there was an increase in volume which again resulted in a substantial move closing above this technical level. The problem occurs when you realize that there will NOT be another buy signal until the system generates a sell signal for those that were not disciplined enough to sell on their MM rules. You could have bought on the break out of the (then) resistance level at (C) and watched for an exit if you found resistance again (D) at the same level it occurred at before (A). A short trade, but a solid 10% before commissions. The most current High Level close is now at 17.625 (E) and the repeated resistance line has been converted to a bounce level at which we expect to see buying occur. This stock has in deed recognized the technical importance of that bounce line and has started up. But where and when should you make your entry ? Just after it closes above that previous high (E) which is now indicated with the Green Line. |