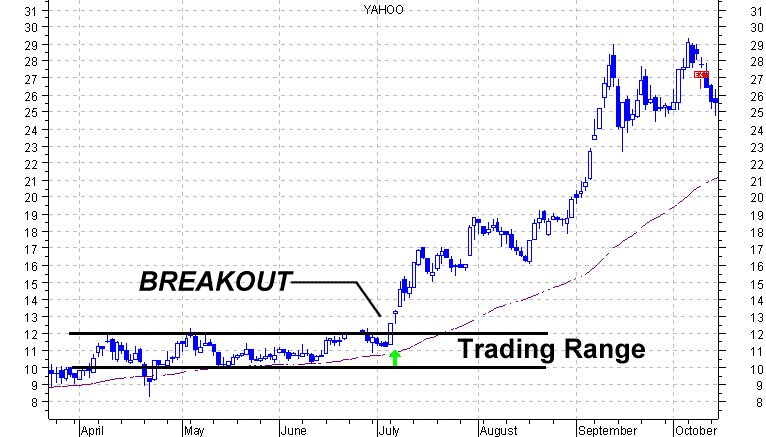

| A BREAKOUT is an easy technical indicator to identify. Of course it is much easier to identify a breakout IF there was a well defined trading range preceding it as there was in the above chart. |
| A trader could very simply scan a multiple of charts watching for the formation of trading ranges. Once they have developed well defined levels of support and resistance, the trader would set a stop a a reasonable level above the upper limit if they were looking to go long, or below the lower limit if they were looking to go short. |
| In general, the longer the length of time that the trading range extends, the longer the length of time that the rise will continue. In addition to this, when the top has been reached, the typical pull back will generally test a support level around a level that would calculate to be approximately 62% of the total rise, but in many cases will bounce from a lower price before forming this support level. |